|
<< Click to Display Table of Contents >> Perforation Data (Oil & Gas only) |
  
|
|
<< Click to Display Table of Contents >> Perforation Data (Oil & Gas only) |
  
|
This column is used to display the perforation data as color shaded depth intervals. There are several ways to edit perforation data, either:
•click on the perforation data column on the log
•double click on the perforation data object on the sidebar
•select Edit > Perforations
•or select Popup > Perforations
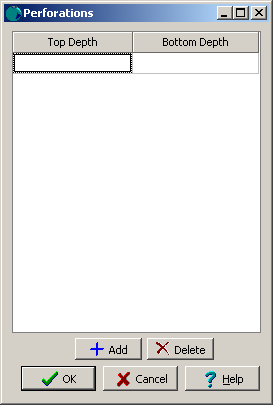
After this the Perforations form will be displayed. At the bottom of this form there are buttons to add and delete oil staining data.

(The appearance of the form will differ slightly depending on if it is WinLoG or WinLoG RT)
The following can be edited on this tab:
Top Depth: This is the top depth for the perforation.
Bottom Depth: This is the bottom depth for the perforation.